BANKNIFTY for 30th DecemberBanknifty’s strength pulled Nifty to massive heights on Friday. A strong buying emerged in all public sector banks due to second round of RBI’s operation twist (meaning RBI auctioned or sold short term Securities and simultaneously used that money to buy long term securities to reduce the interest on Long term bonds). This also helped buying in Axis Bank and ICICI bank. The massive rise in these three banks- ICICI Bank, Axis Bank & SBI – whose combined weightage is more than 40%, helped BNF increase by 414 points. Now what on Monday? Banknifty is very near to its lifetime high. Good global cues may prop it to 32500. But at that level some selling may start. On 15 min chart there are no clear levels for buying if BNF comes down, like there are for Nifty. However, a not-so-strong buying area is there between 32215 and 32260, so one can buy there with strict SL of 32190. Expect gain of at least 100 points.
All the best. Happy trading.
Search in ideas for "STRONG BUY"

AUDCAD Buy Only All World Buying You Must BuyRisk Reward Ratio is Fine. Strong Buying Breakout .
We See huge buying in this Session.
So Strongly its a BUY .

discounted stock HINDALCOTechnical Analysis Summary:
Trend Analysis: HINDALCO INDUSTRIES LTD is currently exhibiting a bullish trend, characterized by higher lows and higher highs. The stock has shown strong upward momentum.
Breakout Level of 2021: Significant interaction with this level, indicating its importance.
Candlestick Pattern & Price Action: Bullish Engulfing and Doji patterns suggest potential bullish reversals and strong buying interest.
Conclusion:
The stock is currently in a potential buy zone within the green reversal area.
Monitor key support and reversal levels for potential price movements.
The RSI and volume indicate a neutral position with significant trading activity, supporting a potential reversal if buying pressure increases.
Key Levels:
Support Zone (Yellow): Between ₹556-₹603 . This is the range where the stock has shown buying interest and potential support.
Reversal Zone (Green): ₹608-₹639 This zone indicates a potential area for price reversal and is likely where buyers might step in.
Target Levels: ₹728.35 (Target 1), ₹774.75 (Target 2), ₹833.90 (Target 3)
RSI (Relative Strength Index) and Volume:
RSI: The Relative Strength Index (RSI) is currently at 47.02, indicating a neutral position. It suggests that the stock is neither overbought nor oversold.
Volume: The recent volume is 9.01M, showing significant trading activity around key levels.

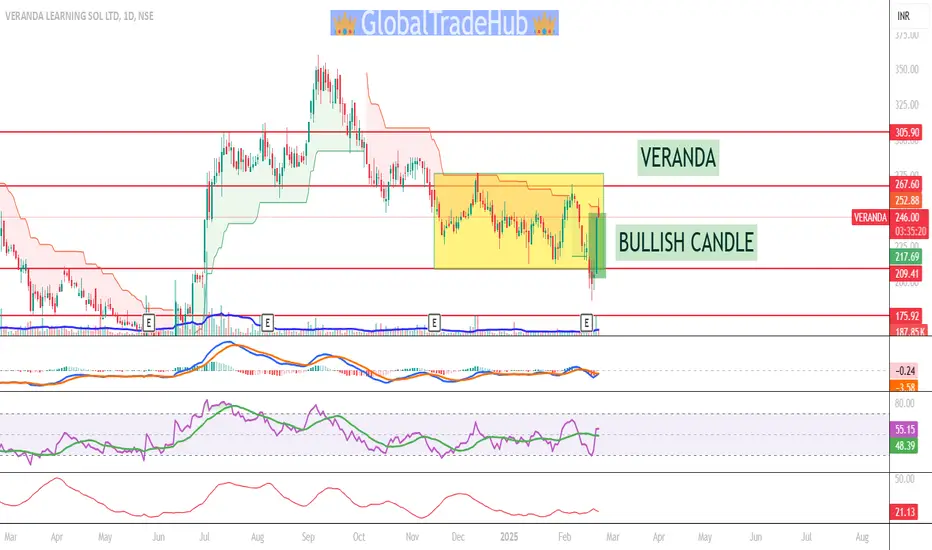
Veranda learning solutions Let's dive into the **technical analysis** of **Veranda Learning Solutions Ltd.** based on typical technical indicators. Since I don't have live market data, I'll guide you through a structured analysis framework. You can use real-time data from a stock charting tool to apply these indicators.
---
### **Technical Analysis of Veranda Learning Solutions Ltd. (VERANDA)**
#### **1. Support and Resistance Levels**
- **Support Levels:**
- These are price zones where the stock has historically found buying interest or has reversed direction.
- **Example Support Levels:** Look for recent lows. If Veranda Learning has recently bounced at ₹250 or ₹230, these could be key support levels. If the price breaks below these, it may signal further downside risk.
- If the stock is approaching these levels and starts to bounce back, these can act as buy signals.
- **Resistance Levels:**
- Resistance is where the stock has faced selling pressure in the past. If the stock has faced difficulty breaking through ₹280, ₹290, or ₹300, these levels could act as resistance.
- A breakout above these resistance levels could signal strong bullish momentum.
#### **2. Moving Averages (MA)**
- **50-day Moving Average (MA):**
- The 50-day moving average helps assess short-term price trends. If the stock is trading above this level, it generally indicates bullish momentum in the short term.
- **Example:** If the stock is at ₹270 and the 50-day MA is ₹265, this would signal short-term bullishness.
- **200-day Moving Average (MA):**
- The 200-day moving average is used for identifying the long-term trend. If the stock is trading above it, it suggests a long-term bullish trend. If below, the stock may be in a long-term downtrend.
- **Example:** If the stock is at ₹270 and the 200-day MA is at ₹260, it confirms a long-term bullish trend.
#### **3. RSI (Relative Strength Index)**
- **RSI Levels:**
- **Above 70:** Indicates the stock is potentially overbought, suggesting a pullback or consolidation could occur.
- **Below 30:** Indicates the stock is potentially oversold, suggesting it may be due for an upward move or reversal.
- **Current Example:**
- If the RSI is **above 70**, the stock could be in overbought territory, suggesting it might face a correction.
- If the RSI is **below 30**, it suggests oversold conditions, potentially indicating a buying opportunity.
#### **4. MACD (Moving Average Convergence Divergence)**
- **Bullish Signal:** When the MACD line crosses above the signal line, it suggests bullish momentum.
- **Bearish Signal:** When the MACD line crosses below the signal line, it suggests bearish momentum.
- **Current Example:**
- If the MACD is currently above the signal line, it signals potential upward momentum for the stock.
- If the MACD is below the signal line, it might indicate a downtrend or consolidation.
#### **5. Volume Analysis**
- **Increasing Volume:** When the stock rises with increasing volume, it suggests strong buying interest, confirming the trend.
- **Decreasing Volume:** If the stock rises or falls with decreasing volume, it may signal weakening momentum, either bullish or bearish.
- **Current Example:**
- If Veranda Learning is rising with increasing volume, it confirms the strength of the upward move.
- If the stock price rises but volume is decreasing, it could suggest that the rally is losing momentum and may not be sustainable.
#### **6. Candlestick Patterns**
- **Bullish Patterns:** Look for **Hammer**, **Bullish Engulfing**, or **Morning Star** patterns during a downtrend. These could signal a reversal to the upside.
- **Bearish Patterns:** Patterns like **Shooting Star**, **Evening Star**, or **Bearish Engulfing** near resistance could signal a reversal to the downside.
- **Current Example:**
- If a **Bullish Engulfing** pattern forms near a support level, it may signal a reversal to the upside.
- If a **Shooting Star** or **Evening Star** forms near a resistance level, it could indicate a potential reversal to the downside.
#### **7. Fibonacci Retracement Levels**
- Fibonacci retracement levels are often used to identify potential support or resistance areas during pullbacks or price corrections. Key levels include **23.6%, 38.2%, 50%,** and **61.8%**.
- **Current Example:**
- If the stock has moved from ₹230 to ₹300, check for retracement levels. The **38.2% retracement** might be around ₹280, and the **50% retracement** could be around ₹265.
- These levels could act as support during a pullback if the stock is in an uptrend.
---
**Disclaimer:**
- I am not a SEBI-registered professional or licensed financial advisor.
- All analysis, recommendations, and opinions provided are based solely on historical price data, patterns, and general market trends.
- Any action you take on the basis of this information is at your own risk. Please consult with a licensed financial advisor before making any investment decisions.
- Technical analysis cannot guarantee future results and may not be accurate in predicting market movements.
- Market conditions and stock prices can be influenced by many factors, including external events, news, and economic data, which are beyond the scope of this analysis.
GODFRYPHLP – Strong Momentum with Trend Reversal Signs #GODFRYPHLP – Strong Momentum with Trend Reversal Signs 🚀
✅ Bullish Breakout Alert! GODFRYPHLP closed strongly on Friday with high volume, indicating strong buying interest.
Key Technical Highlights:
Strong Close: The stock ended the week on a bullish note with significant volume support.
Moving Averages: Closed above the 200MA and all major EMAs on the daily chart, reinforcing bullish momentum.
Demand Zone Reversal: The stock has bounced off a key demand zone, signaling a potential trend reversal.
Relative Strength vs. Nifty: Turned positive on the weekly chart, showing outperformance.
Trading Plan:
📌 Entry: Waiting for consolidation and a better risk-to-reward setup before entering.
📌 Stop Loss: Will be defined based on the consolidation structure.
📌 Confirmation Level: Watching for sustained strength above recent highs.
Final Thoughts:
With strong volume, bullish price action, and improving relative strength, GODFRYPHLP is on my watchlist. I will wait for a better entry point before taking a position.
📢 What’s your view on GODFRYPHLP? Share your thoughts below! 🔥

Oil India Bullish Breakout with Strong Technical and FundamentalHello everyone, i hope you all will be doing good in your life and your trading as well. Today i have brought the daily chart of Oil India Ltd, which looks very promising with a solid mix of technical and fundamental strength. Let me break it down for you guy's:
Technical Analysis
Trendline Analysis:
The stock has been respecting a long-term upward support trendline, bouncing off it multiple times (marked with green circles). This shows strong buyer interest and confidence, especially from institutional players.
The recent breakout from the falling resistance trendline is a game-changer, signaling the start of a bullish phase.
Breakout Confirmation:
What makes this breakout special is the retest near the best entry zone (₹492–480), which adds reliability to the move.
The bullish candlestick pattern near the support further strengthens this setup.
Volume Analysis:
Volume is the backbone of every breakout, and here it hasn’t disappointed. A significant volume spike during the breakout shows strong buying interest.
Historical volume patterns also show increased activity near critical levels, indicating accumulation by smart money.
Key Levels:
Immediate Support: ₹438
Immediate Resistance: ₹533
Targets:
1st Target: ₹533
2nd Target: ₹587
3rd Target: ₹630
Long-Term Target: ₹911
Stop Loss:
Short-term: ₹438
Long-term: ₹362
Indicators:
RSI: Recovering beautifully from oversold levels and showing bullish divergence—this is a good sign of momentum shifting upward.
MACD: Crossed above the signal line, further confirming the bullish momentum.
Moving Averages: The stock has climbed above key short-term EMAs (e.g., 21-day), giving more confidence in the uptrend continuation( Note:- I have not placed any 21 day ema line to keep chart clean, but i have done analysis for this . )
Fundamental Analysis
Industry Overview:
The energy sector is buzzing, with rising energy demand and stable crude oil prices driving growth. Oil India, being a leading exploration and production player, is well-positioned to ride this wave.
Revenue & Profitability:
The company has shown strong revenue growth, benefiting from the favorable pricing environment.
Their solid net profit margins highlight operational efficiency, which is always a big plus.
Dividend Yield:
Oil India is known for consistently rewarding its investors with a great dividend yield, making it a go-to stock for long-term portfolios.
Debt Levels:
A healthy balance sheet with manageable debt is another feather in their cap, ensuring they can weather market volatility.
Future Prospects:
With expansion in exploration projects and increased production capacity, Oil India is set up for solid growth.
Government policies supporting domestic energy production act as an added tailwind for the company.
Oil India Ltd is shaping up to be a great opportunity for both short-term traders and long-term investors:
Technically, the breakout from the falling resistance trendline, supported by volume and strong indicators, sets the stage for further upside.
Fundamentally, the company’s financial health, growth prospects, and attractive dividend yield make it a solid long-term bet.
If the stock sustains above ₹533, we could see strong momentum toward higher targets. For long-term investors, any dips toward the ₹480–492 range may be a good chance to accumulate.
Disclaimer: This post is for educational purposes and not financial advice. Always do your research and manage your risk.
Don’t forget to like and follow for more trading ideas like this. Check out my profile @TraderRahulPal for other detailed insights into technical and fundamental setups. Let’s grow together!

Bajaj Finserv Ltd. chart analysis
The chart of Bajaj Finserv Ltd. (NSE) on a Daily frame, showing price movement, volume, and two key indicators – MACD (Moving Average Convergence Divergence) and RSI (Relative Strength Index). It highlights price divergences, key support and resistance zones, and a potential bullish reversal.
---
🔍 Key Chart Feature and Pattern Observation:
1️⃣ Support & Resistance:
- Support: ₹1,523.25 (blue horizontal line).
- Resistance: ₹1,700.65 (magenta horizontal line).
2️⃣ Bullish & Bearish Divergence:
- Bearish Divergence: Observed on the MACD during the price rise in August-September.
- Bullish Divergence: Observed in December, indicating a potential trend reversal.
3️⃣ Volume Spike:
- A significant volume increase during the recent price surge suggests strong buying interest.
4️⃣ Price Action:
- The price has bounced off the support zone and is approaching the resistance zone.
---
📈 Indicator Analysis:
1️⃣ MACD:
- Bearish Divergence: Previously indicated weakness, leading to a downtrend.
- Bullish Divergence: Recently formed, suggesting potential upward momentum.
- The MACD histogram has turned green, indicating positive momentum.
2️⃣ RSI:
- RSI is currently at 33, suggesting it is recovering from an oversold zone.
- A rising RSI supports the bullish sentiment.
3️⃣ Volume:
- A spike in volume during the upward price movement signals buying strength.
---
📌 Key Levels or Price Levels:
- Support: ₹1,523.25
- Resistance: ₹1,700.65
- Intermediate Resistance: ₹1,690.50
---
📊 Overall Summary:
- The chart indicates a potential bullish reversal supported by a bullish divergence in MACD and rising RSI.
- The recent price surge, accompanied by high volume, suggests strong buying interest.
- If the price sustains above ₹1,690.50, it could break through the resistance at ₹1,700.65.
---
📚 Trading Strategy:
1️⃣ For Long Entry:
- Enter near ₹1,562.05 with a stop-loss at ₹1,523.25.
- Target price: ₹1,700.65
2️⃣ For Short Entry:
- If the price fails to break ₹1,690.50, consider shorting with a stop-loss at ₹1,700.65.
3️⃣ Confirmation Point:
- Wait for confirmation with price action or candlestick patterns near key levels.
---
✅ Conclusion:
The chart signals a bullish reversal with confirmation from the MACD bullish divergence and improving RSI levels. Traders can look for buying opportunities near support levels with proper risk management. A breakout above ₹1,700.65 will strengthen the bullish momentum further. 🚀

Trading Idea for Nuvama!📊 Technical Setup:
The stock is in an uptrend, respecting the rising trendline (📈 marked with arrows).
EMA indicators (20, 50, and 200) are well-aligned ✅, confirming a bullish bias.
The price has recently bounced from the trendline support, showing strong buying interest 🛡️.
💡 Entry Point:
Buy Zone: Around ₹6,800–₹6,850 (current levels) 📍, aligning with the trendline and EMA support.
⛔ Stop-Loss:
Place a stop-loss below the recent swing low at ₹6,730 ❌. This level invalidates the setup if breached.
🎯 Targets:
Target 1: ₹7,100 (near the previous resistance zone) 🥇.
Target 2: ₹7,400 (higher resistance zone, aligning with the rectangle breakout zone) 🥈.
⚖️ Risk-to-Reward Ratio:
For an entry near ₹6,850 with a stop-loss at ₹6,730:
Target 1 (₹7,100): Reward = ₹250 → Risk-to-Reward = 1:2.08 ✅
Target 2 (₹7,400): Reward = ₹550 → Risk-to-Reward = 1:4.58 ✅✅
📌 Logic:
The uptrend is supported by multiple trendline bounces 🔄, indicating strong demand.
Price has held above the 50 EMA 📐, a sign of sustained bullish momentum.
Volume spike near the trendline suggests institutional buying 💰.
⚠️ Caution:
Avoid buying if the price closes below ₹6,730 🚨.
Keep an eye on overall market sentiment 🌐, as external factors can influence stock movement.

Nagreeka Capital & Infrastructure Ltd. Based on Cup and Handle P
1. Pattern Analysis
- Cup and Handle Pattern:
- Timeframe: 5 Years
- Description: The chart exhibits a classic cup and handle pattern, a bullish continuation pattern indicating potential for further upside. The resistance at ₹28 has been breached with a strong breakout, confirming the pattern.
- The extended timeframe of this pattern enhances its reliability and suggests a strong underlying bullish momentum.
2. Volume Analysis
- Volume Behavior:
- Volume remained low during the formation of the cup, signifying accumulation.
- Significant increase in volume during the breakout above ₹28 indicates strong buying interest, validating the breakout.
3. Price Action Analysis
- Key Resistance Level:
- ₹28: The breakout point and previous resistance level.
- Support Levels:
- ₹22–₹24: Expected pullback or retest zone post-breakout.
- ₹18: The lower boundary of the handle, providing strong long-term support.
- Candlestick Analysis:
- The breakout candlestick is a large bullish bar with a close near its high, demonstrating strong momentum and positive sentiment.
4. Validation of Bullish Signal
- The breakout above ₹28 with high volume confirms the bullish signal.
- The handle formation, lasting several months, indicates consolidation and prepares the stock for a breakout with a higher probability of success.
5. Target Setting
- Cup and Handle Target:
- Depth of the cup = ₹28 - ₹12 = ₹16.
- Target = ₹28 + ₹16 = ₹44.
- Incremental Targets:
- Target 1: ₹35 (+25% from ₹28).
- Target 2: ₹44 (+57% from ₹28).
6. Entry and Stop Loss
- Entry Levels:
- Primary Entry: Above ₹28 after confirmation of the breakout.
- Pullback Entry: Near ₹22–₹24 if the stock retests the breakout level.
- Stop Loss:
- Place a stop loss at ₹22, below the pullback zone.
7. Trade Setup Summary
- Entry Levels:
- Above ₹28 for breakout confirmation.
- Near ₹22–₹24 for pullback entry.
- Targets:
- Target 1: ₹35 (+25%).
- Target 2: ₹44 (+57%).
- Stop Loss: ₹22.
8. Final Notes
Nagreeka Capital & Infrastructure Ltd. has confirmed a breakout from a 5-year cup and handle pattern, supported by a strong surge in volume. The extended timeframe of the pattern and robust breakout signal a high-probability trade setup. A pullback to ₹22–₹24, if it occurs, would offer an optimal entry point.

Galaxy Surfactants is showing signs of breaking its ATHSupport Level: The stock has found strong support around ₹3,045, a price zone where buyers have stepped in multiple times, forming a solid base.
Resistance & Breakout Potential: The stock is near its all-time high around ₹3,600. A breakout above this level could trigger a strong upward momentum, as there's no prior price action to offer resistance beyond this zone.
Risk-Reward Ratio: With a Risk-Reward Ratio of 1:10, the stock offers an exceptional opportunity. This means that the potential gain is 10 times the amount risked, making it a favorable entry for risk-averse traders.
EMA Confluence: The stock is trading well above key moving averages — 21 EMA and 200 EMA — signaling strong bullish momentum. The 21-day EMA is providing short-term support, indicating that buyers are in control.
Volume Spike: Increased trading volumes suggest strong interest in the stock, often a precursor to a big price movement. A notable spike in volume alongside price action can confirm a potential breakout.
Momentum Indicators: Momentum oscillators like RSI (Relative Strength Index) are likely pointing to a continuation of the bullish trend. If the RSI approaches overbought levels, it might indicate strong buying pressure.
Overall View: Based on these technical indicators, Galaxy Surfactants is showing signs of breaking its all-time high, offering an attractive opportunity with a strong Risk-Reward Ratio of 1:10. If it breaks above ₹3,600, we could see a continuation of the bullish rally.

ICICI Prudential Life Insurance - STOCK Analysis
ICICI Prudential Life Insurance - STOCK Analysis
This chart of ICICI Prudential Life Insurance (NSE) shows a strong bullish recovery:
Key Observations:
Current Price:
The stock is trading at ₹767.60, down by ₹1.75 (-0.23%) for the day.
Rectangle Pattern:
The chart displays a double bottom pattern, similar to the previous chart of HDFC Life, where the price declined significantly twice and then bounced back.
The highlighted box shows the price drop of ₹327.65 (-45.51%) and the subsequent recovery.
Price Projection:
The projected price move is indicated by the blue arrow, suggesting a 44.48% upside from the current levels, with a target price of around ₹1,100.
Volume (CVD - Cumulative Volume Delta):
The CVD shows 92.16K, indicating strong buying momentum, which reinforces the bullish trend.
Fundamental Analysis of ICICI Prudential Life Insurance:
Strong Market Position:
ICICI Prudential Life is one of the largest life insurance companies in India, holding a significant market share with a wide customer base. It has a robust distribution network through ICICI Bank branches and other channels.
Profitability:
Net Premium Growth: The company has been recording steady growth in its premium collection, showing resilience despite market volatility.
Solvency Ratio: As an insurance company, ICICI Pru Life maintains a strong solvency ratio, which is essential for long-term growth and policyholder trust.
Investment Portfolio:
Insurance companies heavily invest in various financial instruments, and ICICI Pru has a balanced and diversified portfolio in equity and debt markets. This helps in managing the risks associated with market fluctuations and improving returns.
Competitive Edge:
Technological Adoption: ICICI Pru has been leveraging technology to improve customer experience, with innovations in policy issuance, claims processing, and online platforms.
Risks:
Interest Rate Sensitivity: Like all insurers, ICICI Pru’s performance is linked to interest rates. Rising rates could affect investment portfolios and policyholder returns.
Regulatory Changes: Changes in insurance regulations could impact the company’s operations and profitability.
Overall Analysis:
The technical chart suggests a strong bullish trend, with a potential upside of 44.48% if the projected pattern completes.
Fundamentally, ICICI Prudential Life is in a solid position with stable financials, market leadership, and technology-driven growth.
Long-term investors may consider this stock given its strong fundamentals and technical signals. However, investors should monitor macroeconomic factors like interest rates and insurance regulations.

Breaking All-Time High After 2.6 Years! Massive Uptrend Ahead!
✅The stock is breaking its all-time high after 2.6 years, signaling a strong upward move.
✅Strong support around 1300 levels due to the previous resistance now turned support. The breakout above the ATH suggests a potential move towards 1950+ levels.
✅RSI is at 67showing strong bullish momentum. MACD histogram is positive, supporting the breakout with bullish signals.
✅Significant volume increase confirms strong buying interest and bullish sentiment, backing up the breakout scenario.
✅The company has shown steady revenue growth and strong profit margins. Its solid balance sheet and effective cost management contribute to financial stability.
✅A leading player in the fintech industry, the company has a strong presence in the Indian market. Continuous innovation and expansion provide a competitive edge.

Broke 1-Year Channel Strong Uptrend Ahead With Solid Support
✅ The stock broke out of an upward channel after almost a year, signaling a strong upward move.
✅ Strong support around 2620 levels with the 100 EMA and trend support. The breakout suggests a potential move towards 3500+ levels.
✅ RSI is at 66 showing strong bullish momentum. MACD histogram is positive, supporting the breakout with bullish signals.
✅Volume increase confirms strong buying interest and bullish sentiment, supporting the breakout scenario.
✅A leading player in the real estate sector, the company has a strong presence in the Indian market. Continuous expansion and innovation provide a competitive edge.

Big Volume and Breakout Alert- Ready for a Strong Move✅The stock is breaking out from a descending trendline, signaling a strong upward move. Strong support around 626 levels with the 100 EMA and trend support. The breakout suggests a potential move towards 970+ levels. RSI is at 56showing bullish momentum. MACD histogram is positive, supporting the breakout with bullish signals. Huge volume spike confirms strong buying interest and bullish sentiment, backing up the breakout scenario.
✅The company has shown steady revenue growth and strong profit margins. Its solid balance sheet and effective cost management contribute to financial stability. A leading player in the chemical sector, the company has a strong presence in the Indian market. Continuous innovation and expansion provide a competitive edge.

Monopoly Business :- Strong Breakout with huge volume ✅The stock is breaking out from an ascending channel, signaling a strong upward move. Strong support around 1900 levels due to the trendline. The breakout suggests a potential move towards 3200+. RSI is at 73 showing strong bullish momentum. MACD histogram is positive, supporting the breakout with bullish signals.Huge volume spike confirms strong buying interest and bullish sentiment, backing up the breakout scenario.
✅A leading player in the depository services sector, the company has a strong presence in the Indian market. Continuous innovation and expansion provide a competitive edge. The depository services sector is experiencing robust growth driven by increased market participation and digital transformation. The company is well-positioned to capitalize on these trends

Breaking Out Above 2-Year Resistance Strong Uptrend Ahead!
-The stock is breaking out above a 2-year old rising resistance, signaling a strong upward move.
-Strong support around 837 levels with the 200 EMA and trend support. The breakout suggests a potential move towards 1000/1170 levels.
-RSI is at 59showing bullish momentum. MACD histogram is positive, supporting the breakout with bullish signals.
-Volume increase confirms strong buying interest and bullish sentiment, supporting the breakout scenario.
-The company has shown steady revenue growth and strong profit margins. Its solid balance sheet and effective cost management contribute to financial stability.
-A leading player in the steel industry, the company has a strong presence in the Indian market. Continuous innovation and expansion provide a competitive edge.
-The steel sector is experiencing robust growth driven by infrastructure development and industrial demand. The company is well-positioned to capitalize on these trends.

Long SuryodayAnalysis and Prediction:
Suryoday Small Finance Bank Ltd (NSE: SURYODAY) is currently demonstrating a strong bullish trend on the weekly chart, making it an attractive candidate for a long position. Here's a detailed breakdown of the analysis:
Price Action: The stock has been on a significant upward trend since March 2023, consistently forming higher highs and higher lows. Recently, it has broken above the resistance level around INR 200, indicating strong bullish momentum.
Moving Averages: The 50-week Simple Moving Average (SMA) has crossed above the 200-week SMA, forming a Golden Cross, which is a strong bullish signal. The current price is also trading well above both the 50-week and 200-week SMAs, reinforcing the bullish sentiment.
Support and Resistance: The breakout above the previous resistance at INR 200 now acts as a strong support level. The next significant resistance level is around INR 240. However, aiming for a 30%+ profit target, the target price is set at INR 280.
Volume: The recent surge in volume accompanying the price increase suggests strong buying interest and institutional participation, which is a positive indicator for the continuation of the upward trend.
Relative Strength Index (RSI): The RSI is currently at 60.45, which is in the bullish zone but not yet overbought, indicating there is still room for further upward movement.
Trade Setup:
Entry: The ideal entry point for this trade is at the current market price around INR 207.90. If the price pulls back to the support level of INR 200, it provides an additional entry opportunity.
Stop Loss: A stop loss should be placed just below the support level, around INR 180-170, to protect against any potential downside risk.
Target: The profit target is set at INR 280, which represents a 30%+ increase from the current price and aligns with the next major resistance level.
Conclusion:
Suryoday Small Finance Bank Ltd presents a compelling long trade opportunity with strong technical indicators supporting further upward movement. The breakout above key resistance, supported by high volume and favorable moving average dynamics, suggests a continuation of the bullish trend. Traders should consider entering at the current price with a well-defined stop loss and target to manage risk effectively.

28th May GOLD ANALYSISCurrent Market Overview:
Gold is currently exhibiting a fluctuating trend influenced by a mix of global economic factors, including interest rate decisions by major central banks, geopolitical tensions, and fluctuations in the U.S. dollar. As of the latest data, gold prices are trading within a range, showing both bullish and bearish signals.
Technical Analysis:
Gold's price action suggests a potential for both upward and downward movement within specified zones. Key technical indicators such as moving averages, Relative Strength Index (RSI), and Fibonacci retracement levels are being considered to determine optimal entry and exit points.
Trade Plan
Sell Zone: 2366-2370
Entry Point: Initiate sell orders within the range of 2366 to 2370.
Rationale: This zone is identified as a potential resistance level where selling pressure is expected to increase. Historical price action shows multiple rejections at this level, suggesting a strong sell-off point.
Buy Zone: 2338-2341
Entry Point: Initiate buy orders within the range of 2338 to 2341.
Rationale: This zone is identified as a potential support level where buying pressure is expected to increase. Historical price action indicates strong buying interest at this level, making it a strategic entry point for long positions.

Book Of Meme Price Prediction: Can BOME Reclaim ATH? The Book Of Meme Price has surged nearly 34% in the last week showing resilience.
The BOME crypto was trading close to $0.011, recording a positive development of 2.16% in Intraday.
Book of Meme (BOME) might emerge as one such contender if Investors are looking for potential winners following the recent conclusion of the Bitcoin halving. BOME is a Solana-based meme coin that is currently trading at $0.01001. Although it has experienced minor fluctuations in the past day and week, it has seen an impressive surge of 917.24% since its inception.
As the market buzzes with speculations, investors are apprehensive about whether BOME will continue to provide impressive returns or lose the gains. Let's delve into further details to understand the potential of Book of Meme crypto in the upcoming sessions.
Book Of Meme Price Shows Resilience After A Significant Jump This Week!
BOME's price today stands at $0.01001, having experienced a positive development of 2.16% within the past day. Over the past week, the memecoin faced selling pressure, with its value dropping by nearly 40%. However, This week, the bulls made a comeback at the lower levels and BONk has managed to recover nearly 75% of the losses incurred in the last week.
Despite these short-term fluctuations, the overall trend remains largely positive, with a surge of 917.24% since its inception. This indicates BOME's potential and resilience.
According to CoinMarketCap, BOME is currently the 120th largest cryptocurrency, with a market capitalization of $620.59 million. Out of a total supply of 69 billion BOME tokens, 55.2 billion tokens are currently in circulation.
Although trading volume has decreased by 24.28% within the past 24 hours, BOME still maintains a healthy volume-to-market cap ratio of 44.26%. This suggests sustained interest and liquidity.
Book Of Meme Price Technical Outlook.
The RSI for BOME is at 53.98, indicating strong buying interest among users. Additionally, the SMA at 51.96 points has formed a bullish crossover with the RSI. This is often a sign of continued upward momentum in the absence of bearish signals.
In March, The higher RSI values led to a significant price correction. However, recent buying growth suggests that BOME's current RSI level could indicate sustained buying pressure rather than an imminent reversal.
Conclusion.
Book of Meme (BOME) is a Solana-based meme coin that has gained 917.24% since its inception. The crypto is currently trading at $0.01001, with a market capitalization of $620.59 million and 55.2 billion tokens in circulation.
Despite short-term fluctuations, the overall trend remains positive, indicating BOME's potential and resilience. The RSI for BOME is at 53.98, indicating strong buying interest among users, and the SMA has formed a bullish crossover with the RSI, suggesting continued upward momentum in the absence of bearish signals.
Technical levels:
Support levels: $0.0078 and $0.0015
Resistance levels: $0.0148 and $0.020
Disclaimer
The views and opinions stated by the author, or any people named in this article, are for informational purposes only and do not establish financial, investment, or other advice. Investing in or trading crypto or stock comes with a risk of financial loss.

UPL: Techno Fundamental AnalysisSomehow I have seen when there is an issue with monsoon (below par) this stock keeps on popping up in my radar. Reason: It's a AgroChem company (phosphate fertilizer producer #1).
I saw some analysts also giving Buy call in this. So before putting long term bet, was looking at the Funda-Techno Analysis of NSE:UPL
Here are my thoughts:
Fundamental :
DVM (Durability-Valuation-Momentum) score: 60-60-38 (Financially strong, valuationwise comfortable, technically neutral)
Consensus price trg from analysts: 760 (28% upside) in 1 yr
The consensus recommendation from 24 analysts for UPL Ltd. is BUY:
(11 Strong Buy, 6 Buy, 6 Hold, 1 Sell)
EPS is expected to grow by 6.4% in FY24
EBIT is expected to grow by 7.1% in FY24
Dividend per share is expected to grow by 6.4% in FY24
Capital expenditure is expected to grow by 60.7% in FY24
Technical :
In Monthly chart: It's actually in the golden zone of Fib series.
See the RSI descending triangle .
The current level is a good support area.
However best way is to do is a SIP where one can accumulate over a period from 600-500 area for an upside of upto 760/780.
SIP levels are shown in the chart:

XTZ/USDT Analysis: Anticipating a Bullish Bounce Towards 1.055 ?
Introduction:
In this technical analysis, we will explore the potential trading opportunities for the XTZ/USDT pair. By employing a Gann Fibonacci tool and considering recent price movements, we have identified key buying areas and a profit-taking level.
Buying Area - 0.844 to 0.856:
Our analysis indicates that the XTZ/USDT pair has established a strong buying area between the 0.844 and 0.856 price levels.
Historical price action in this range suggests that there is significant support, making it an attractive entry point for traders. Buyers are likely to step in and defend their positions in this region, creating a potential price reversal.
Price Projection - Targeting 1.055:
Based on our analysis, we anticipate a bullish bounce in the XTZ/USDT pair with a price target of 1.055. This level is derived from a Gann Fibonacci tool, which is plotted from the high on April 16, 2023, to the low on June 10, 2023.
The 0.75 Fibonacci level aligns with the price target of 1.055, indicating a high probability of a strong resistance-turned-support zone. Traders can consider this level as a potential area to book profits.
Conclusion:
In summary, our technical analysis on the XTZ/USDT pair suggests a favorable trading opportunity. The buying area between 0.844 and 0.856 offers an attractive entry point, with a bullish bounce anticipated towards the 1.055 price level.
Additionally, the Gann Fibonacci tool reinforces the 1.055 level as a suitable area to book profits. As with all trading ideas, traders are encouraged to exercise caution and employ appropriate risk management measures.

SBIN 401 - Why we are negative on SBIN Below are the reasons for our negative view on SBIN.
SBIN has rallied 40 percent in the current year 2021, so far, and surged 151 percent in the last one year means Traders have already moved the price according to the result announced.
Technical reasons
Last Top has not been broken yet.
Ultra high volume near the last top with out breaking suggests weakness. ( reference : Ultra high volume up bars (the classic trap of “Smart Money!!)
Professionals are selling into the public buying – Higher volume
Bank Nifty 34606 - also facing stiff resistance zone in 34606 to 35575
Rules for The End Of a Rising Market
• The high or ultra high volume up bar must be into fresh new ground and will have a strong bull run in the background. - Valid
• The NEWS will be good and that is to mislead you. You will have the urge to buy because the media, brokers etc will be recommending
this as a strong buy when they should in fact be warning you not to buy or indeed sell!! - Valid
• If the market is gapped up and is approaching or at previous resistance then this is an even stronger sign of weakness -Valid

GOLD SETUPS FOR THIS WEEK !!Alright so, what kind of situation we have in gold for the coming week??
If we see Friday's closing it closed pretty high at 1735 level. So, for the coming week 1725-1735 region will serve as a strong buying region and if prices test 1717 levels then it is a must-buy don't miss that great buying opportunity.
While on the other hand 1765-1773 region will serve as take profit region as we have to see the market reaction at that point!!! ***But do not short!!!!
We are seeing no indicators in this analysis and it's completely on price action.
XAUUSD is following the trend channel beautifully giving us a strong buying signal here.
Also, there is going to be a rally to 1800. So, if in this week we get a daily close above 1775 and prices stabilizes there for some time then we might be taking another long there!!! But after confirmation.
FOR FURTHER UPDATES STAY TUNED WITH US AND FOLLOW ME!!
